The cap table is one of the products inside the Equity Methods Client Portal, and part of the reason clients use it. It gives a company a live view of its ownership, down to the individual tranche of each award.
Clients have full autonomy to edit their cap table, including classes and hurdles, while Equity Methods specialists monitor it around the clock and shape the experience for each client.
Problem & GoalsCap tables and exit scenarios usually live in spreadsheet models built by consultants. Admins can't model payouts themselves, and routine changes mean rebuilding or asking for help. Clients needed control over their own data without losing the oversight of specialists.
- Let clients view and edit awards at the tranche level
- Support hypothetical awards, so teams can show potential new hires more information and documentation
- Give participants their own login view, with each organization's branding and control over what participants can see
Different questions need different views of the same data, so the design lets people switch between them instead of building one dense table.
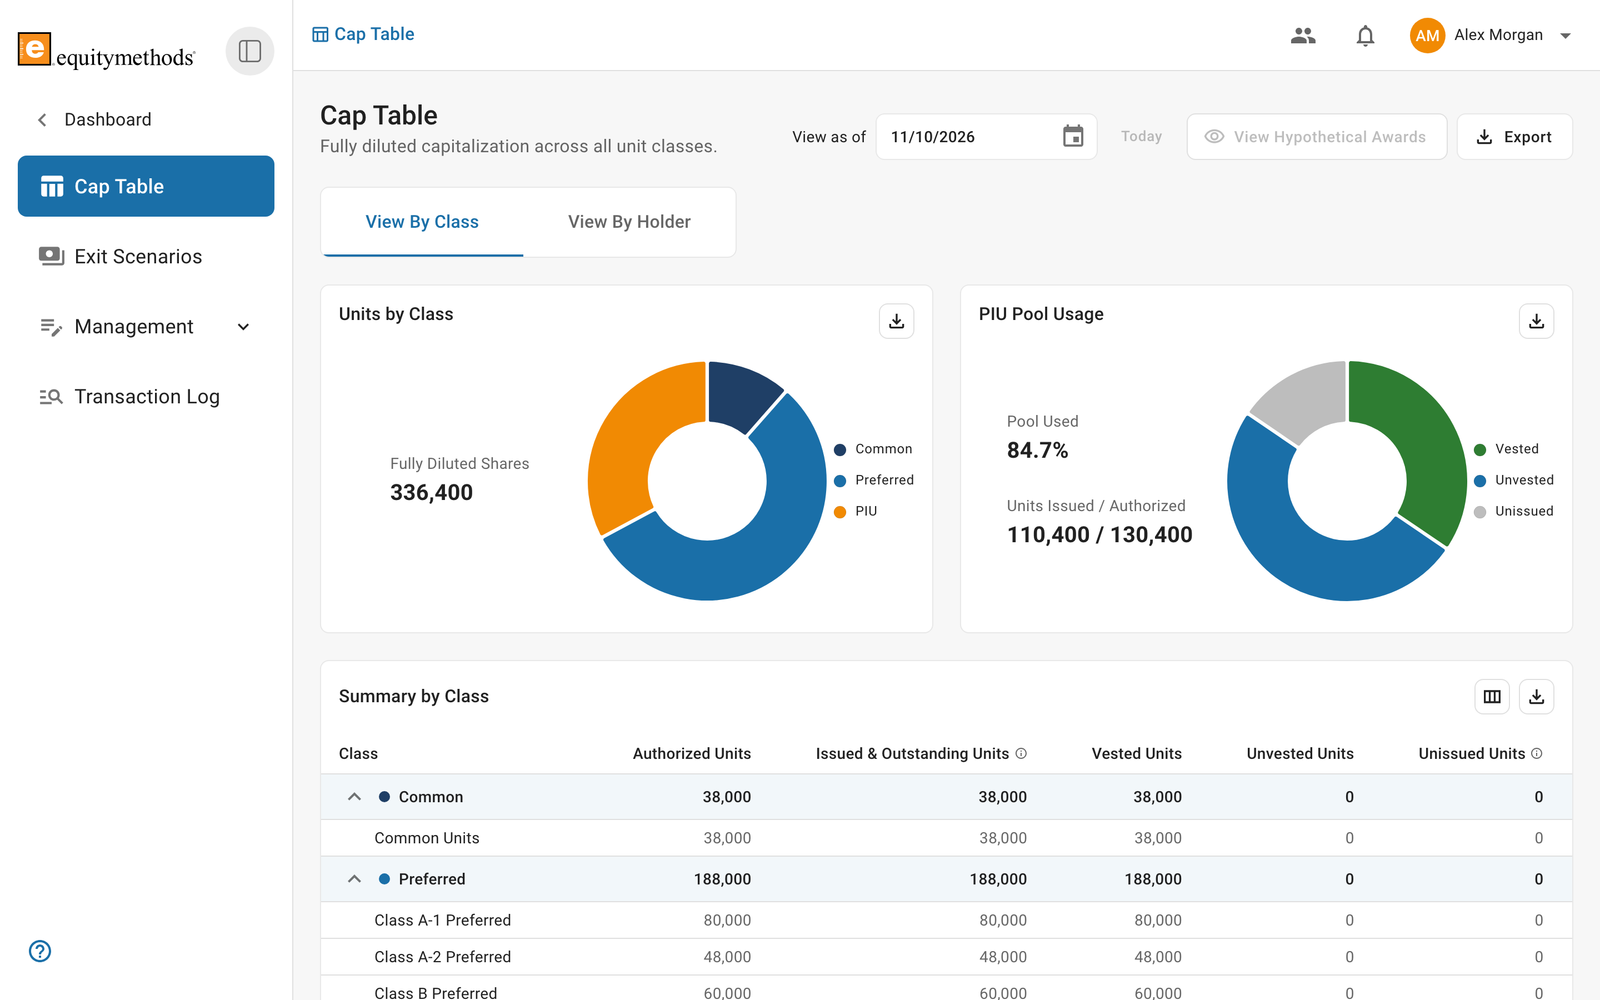
By class
The default view groups ownership by type of security, which is how most teams think about the company's structure.
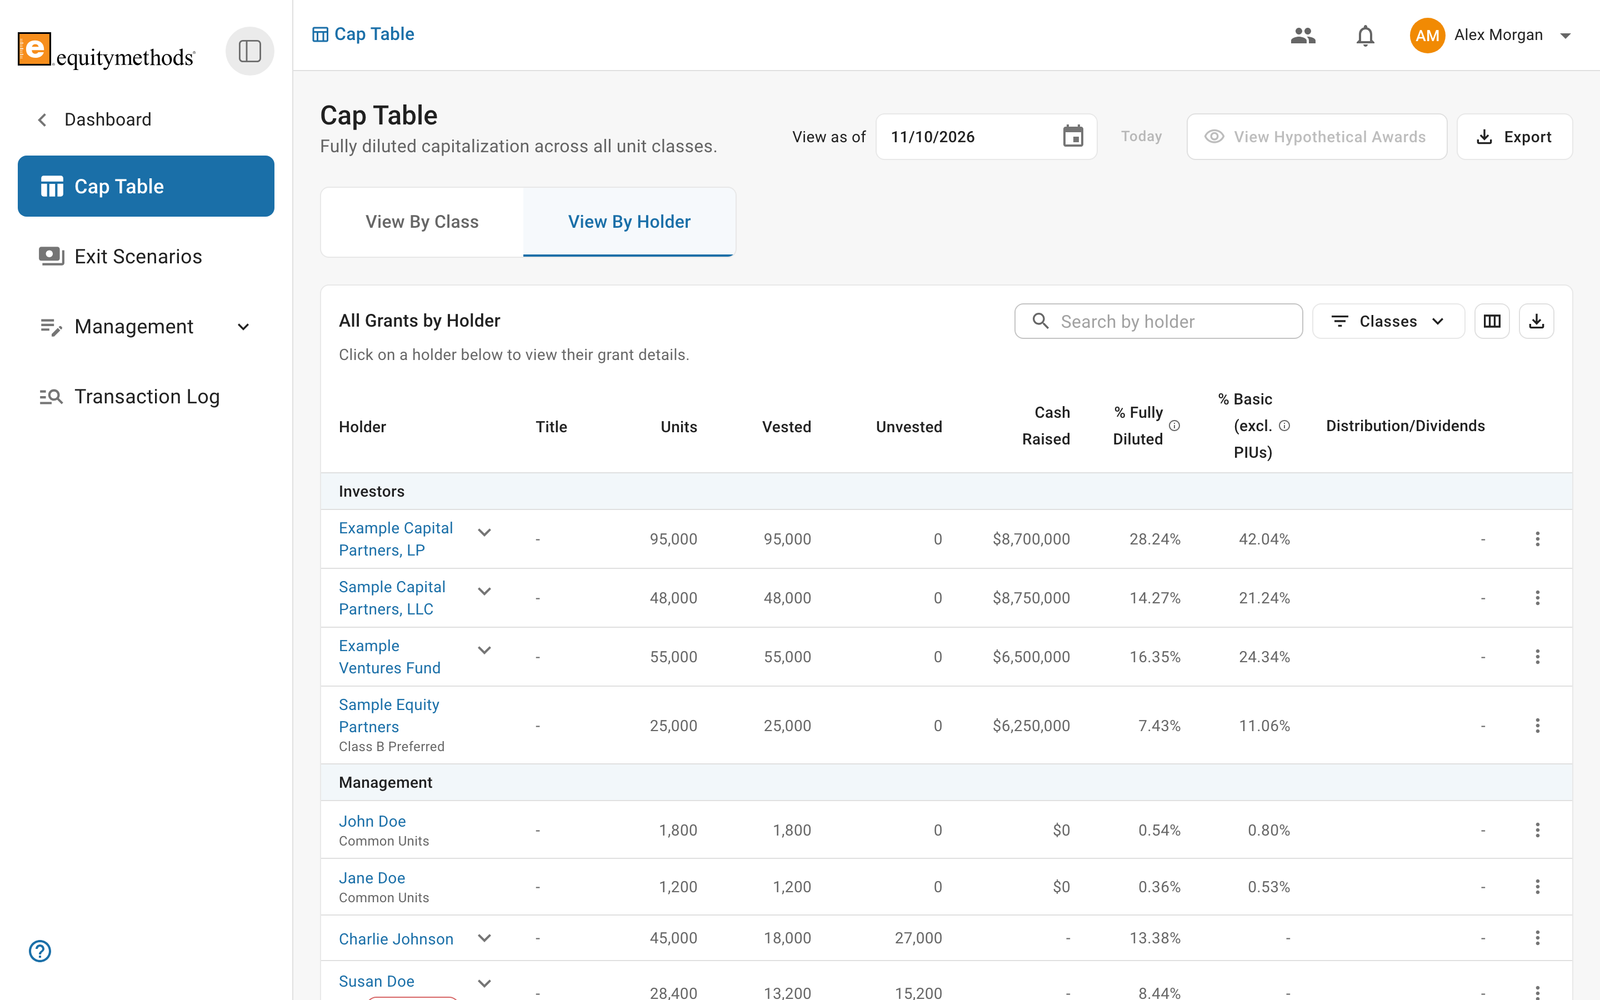
By holder
The same data regrouped by person or entity, for when the question is who owns what.
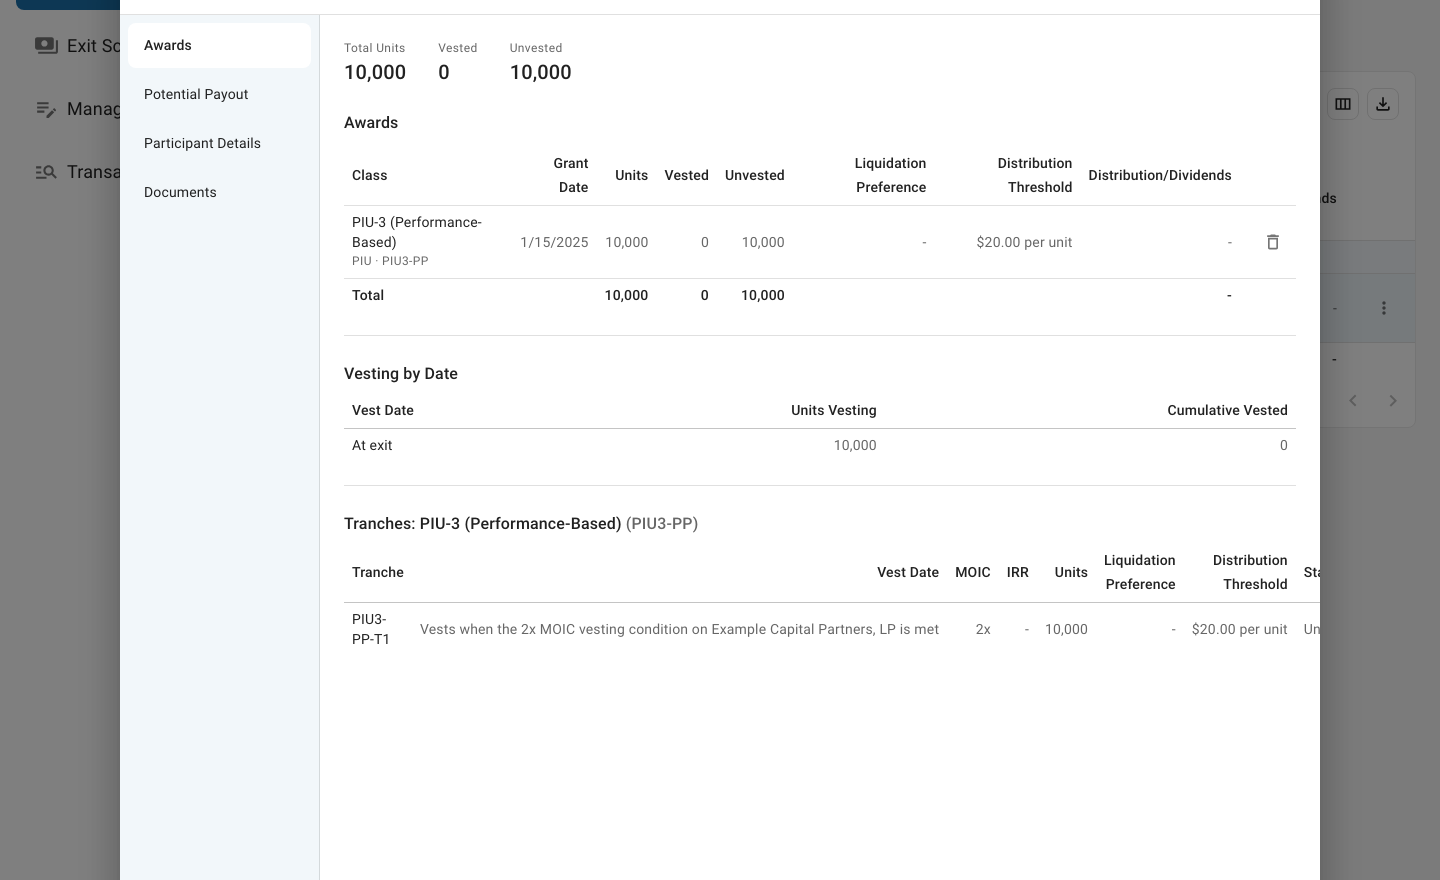
Tranches
Clicking into a holder opens their awards, with each award broken into its tranches, including vest dates and conditions, so a team can see exactly how and when units vest.
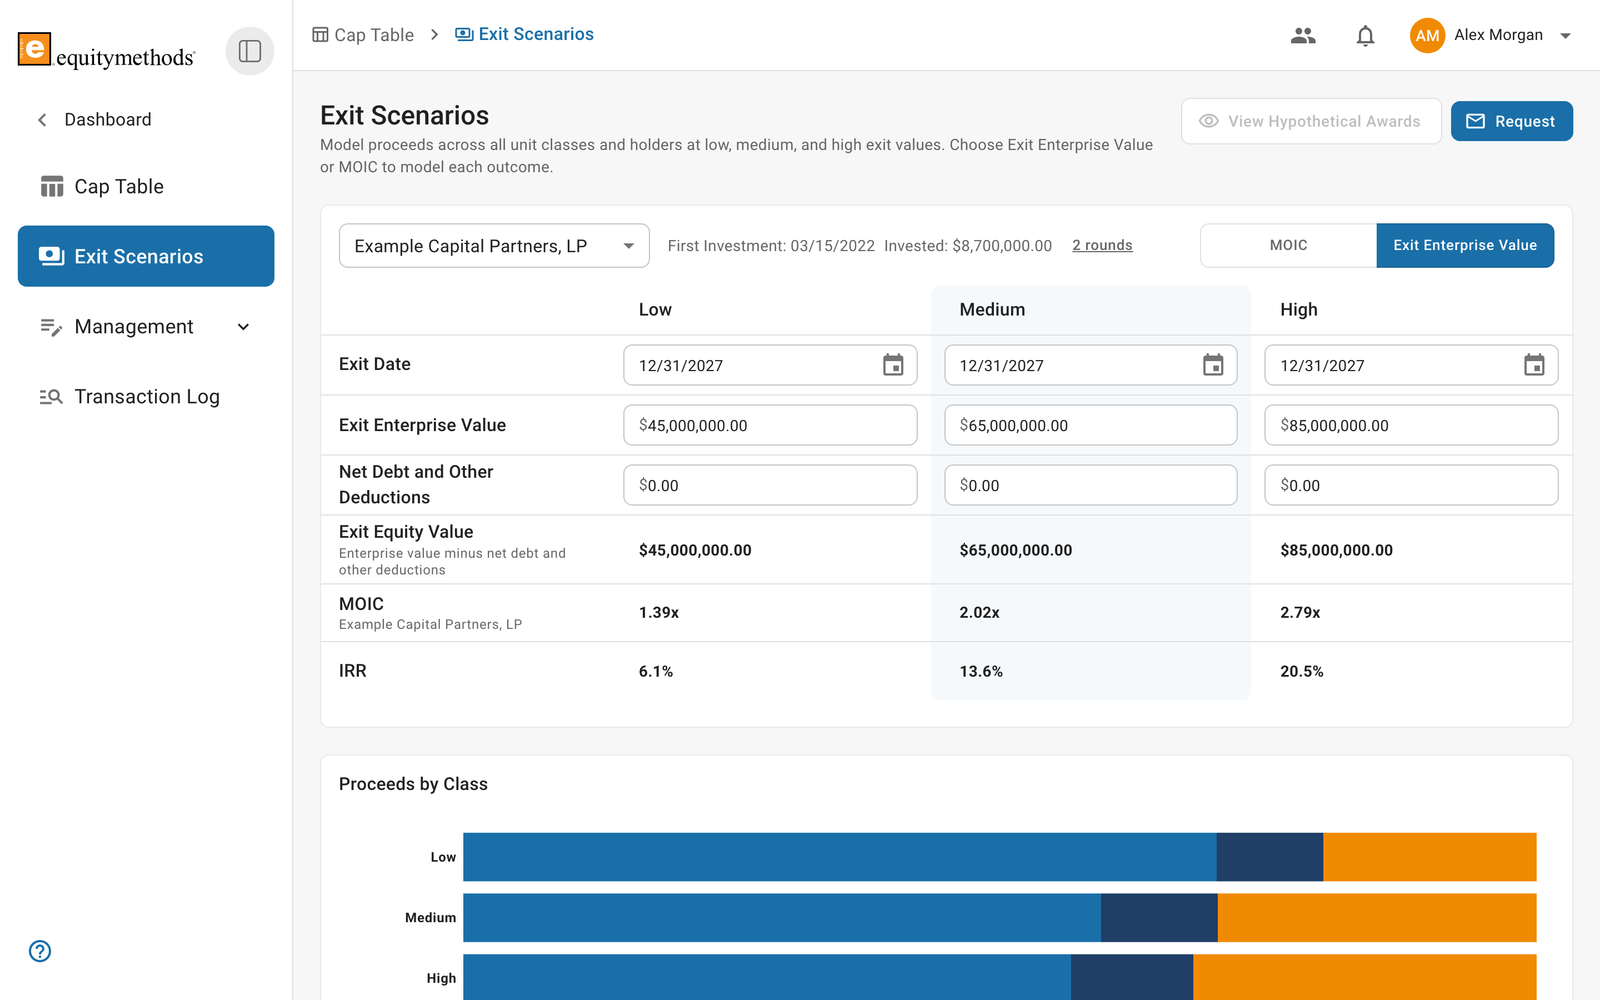
Exit scenarios
Teams can test how ownership and payouts change under different exit outcomes, so planning conversations start from numbers instead of guesses.
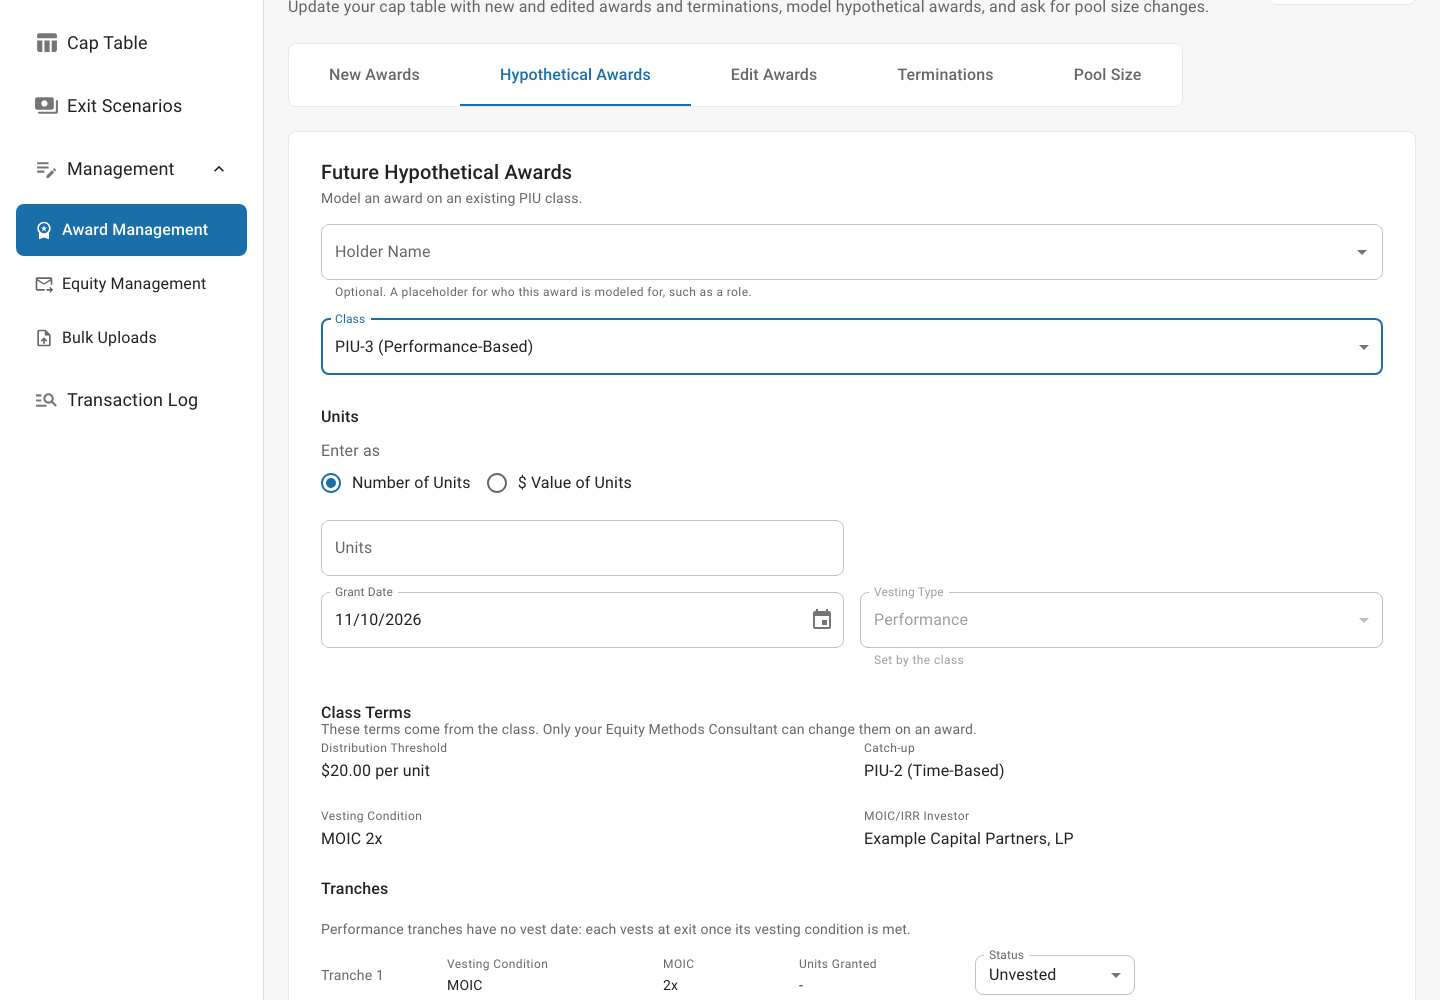
Hypothetical awards
Under Management, teams can model an award that hasn't been granted yet. It shows how a planned grant would change payouts, and gives a potential new hire more information before they join.
Your equity
Each participant gets a personal login view with only their own holdings. Organizations can add their own branding and choose what participants see and what stays hidden.
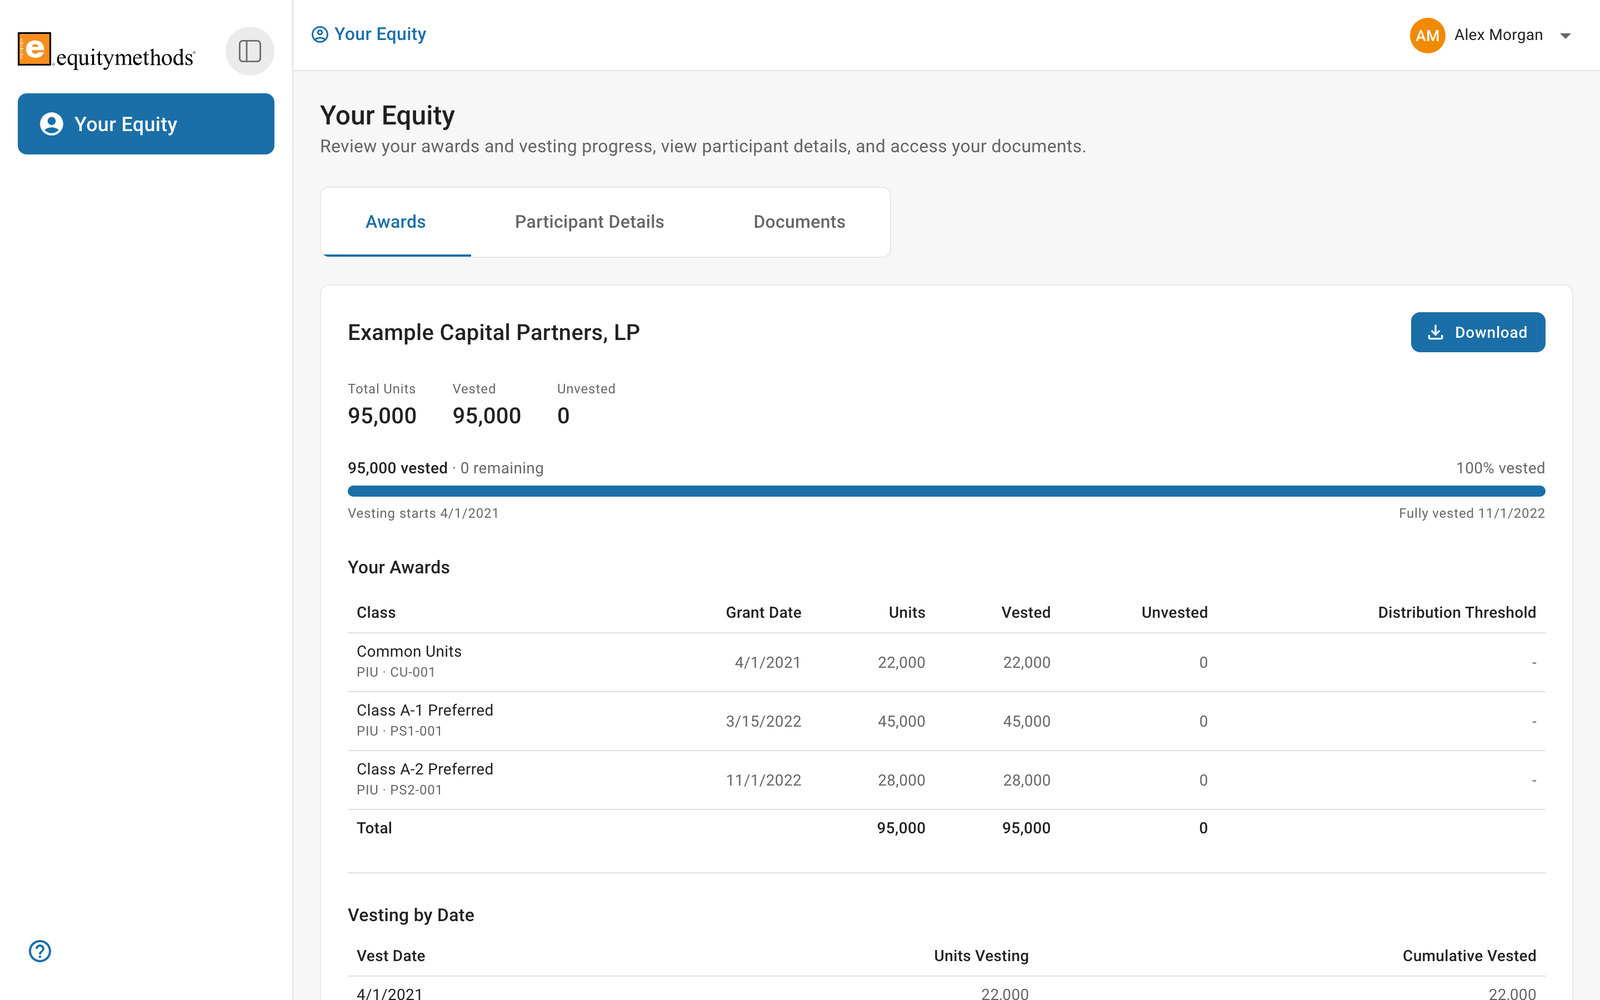
All data shown is sample data for a fictional company.
OutcomeThe cap table gives clients control over their own data, backed by specialists who monitor it and build the custom experience.
ReflectionHow different the two audiences were. A company team wants the full picture, while an employee wants one number they understand. Designing for both meant treating them as separate experiences.
I'd involve engineering earlier to align on how the data is structured. The views depend heavily on the shape of the underlying data, and agreeing on it first would have saved design rework.