Forecasting is one of the products inside the Equity Methods Client Portal, and one of the main reasons clients log in. It complements the forecasting services Equity Methods already provides by giving clients flexibility and autonomy to model scenarios on their own.
Clients can build scenarios, compare them, and break the results down by the categories that matter to them, such as award type or location, without waiting on a consultant.
Problem & GoalsEquity Methods prepared expense forecasts offline, so trying a change meant asking a consultant to rerun it. The clients are sophisticated finance teams, and they wanted fast, self-service scenario modeling.
- Give clients flexibility to model their own scenarios
- Keep the Equity Methods baseline as a trusted reference point
- Let clients break results down by the categories they care about
Forecasts are built from scenarios, so the design is built around comparison. Every forecast opens with a baseline scenario that the firm maintains and clients can't edit. Clients add their own scenarios next to it, change one or two assumptions, and see how the results move.
Library
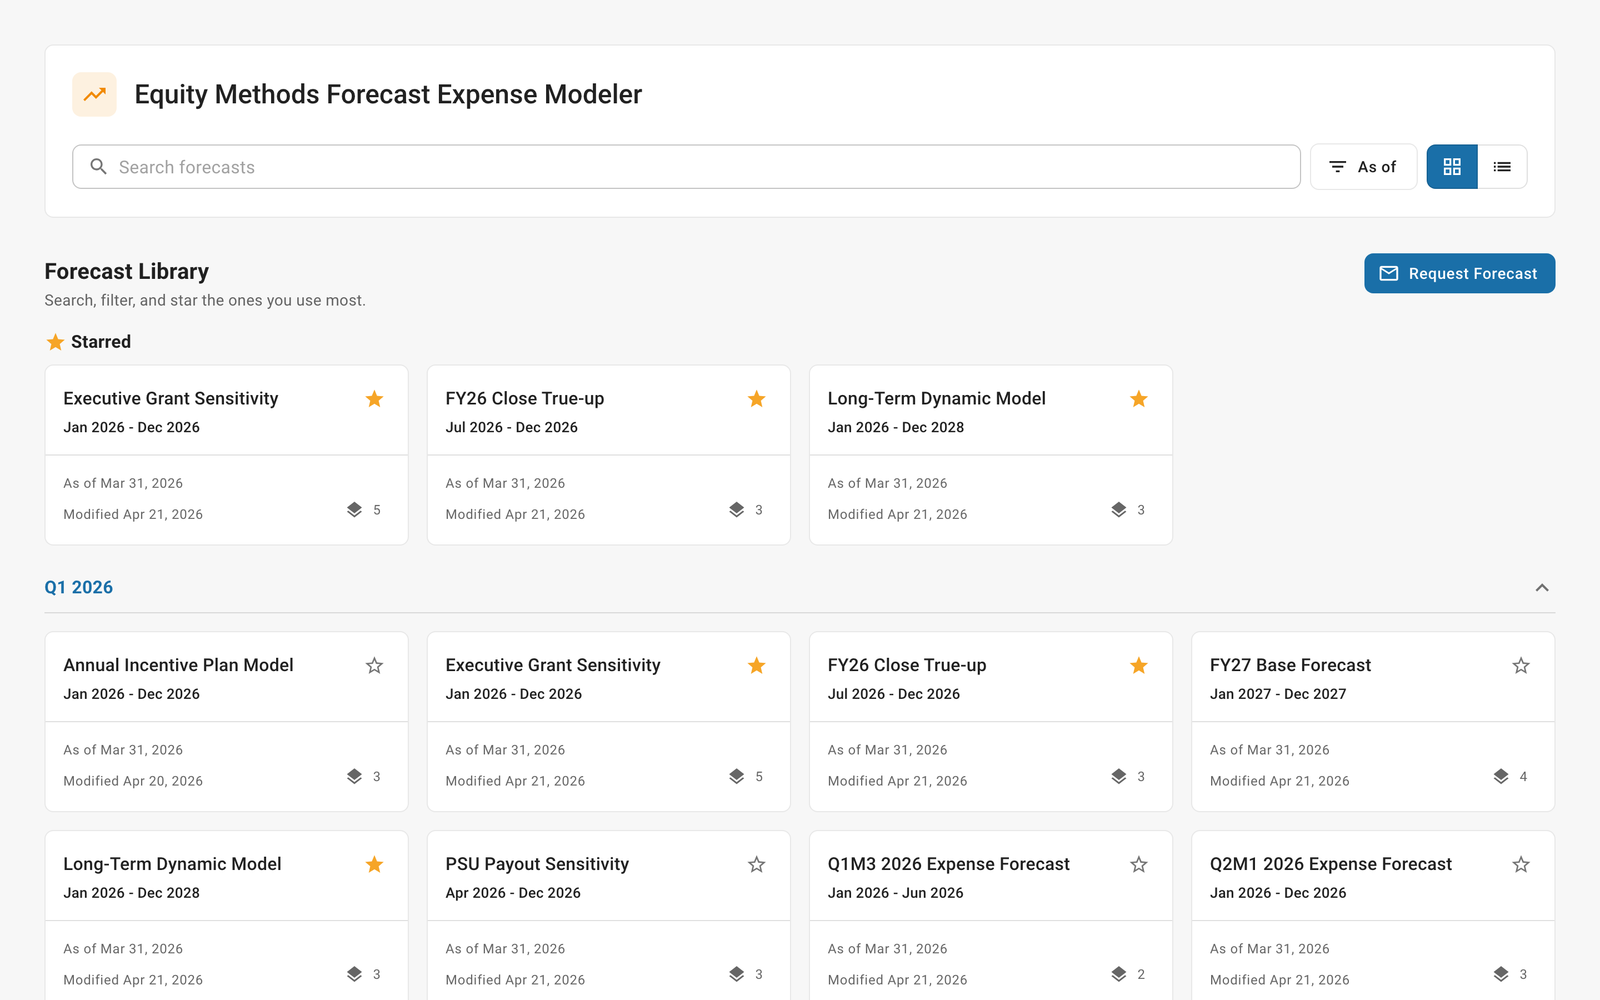
Clients land on a list of their forecasts, so they can pick up where they left off or start a new one.
Scenarios
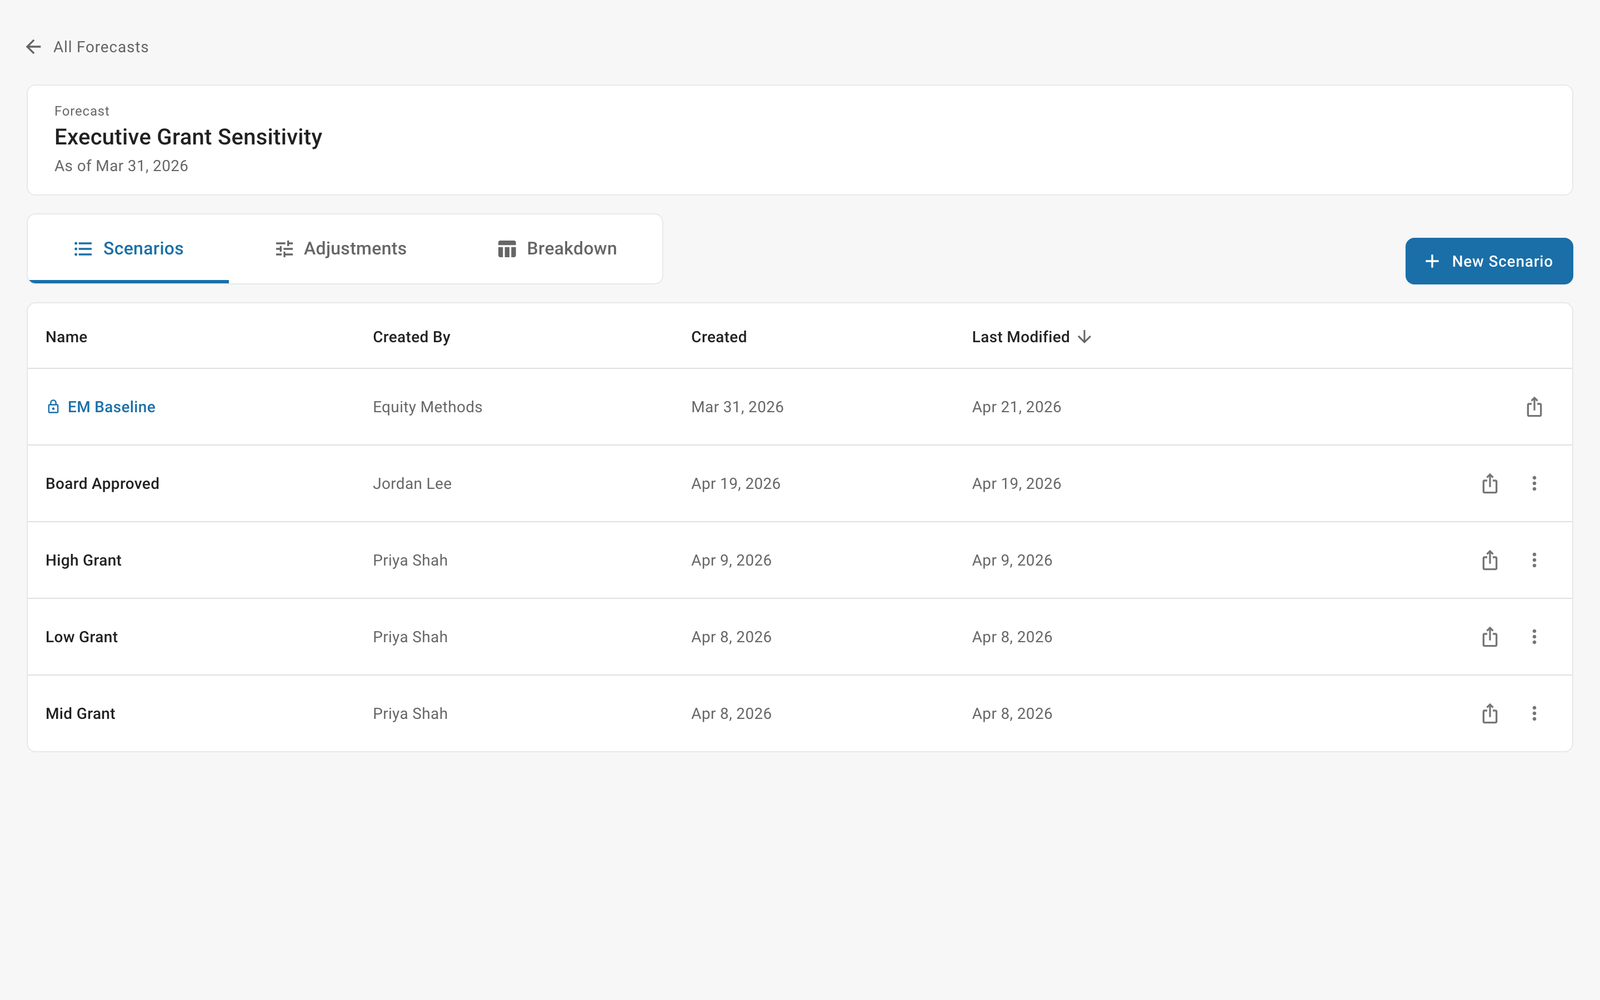
Each forecast shows its scenarios side by side. The baseline is marked and locked so there is always a fixed point to compare against.
Adjustments
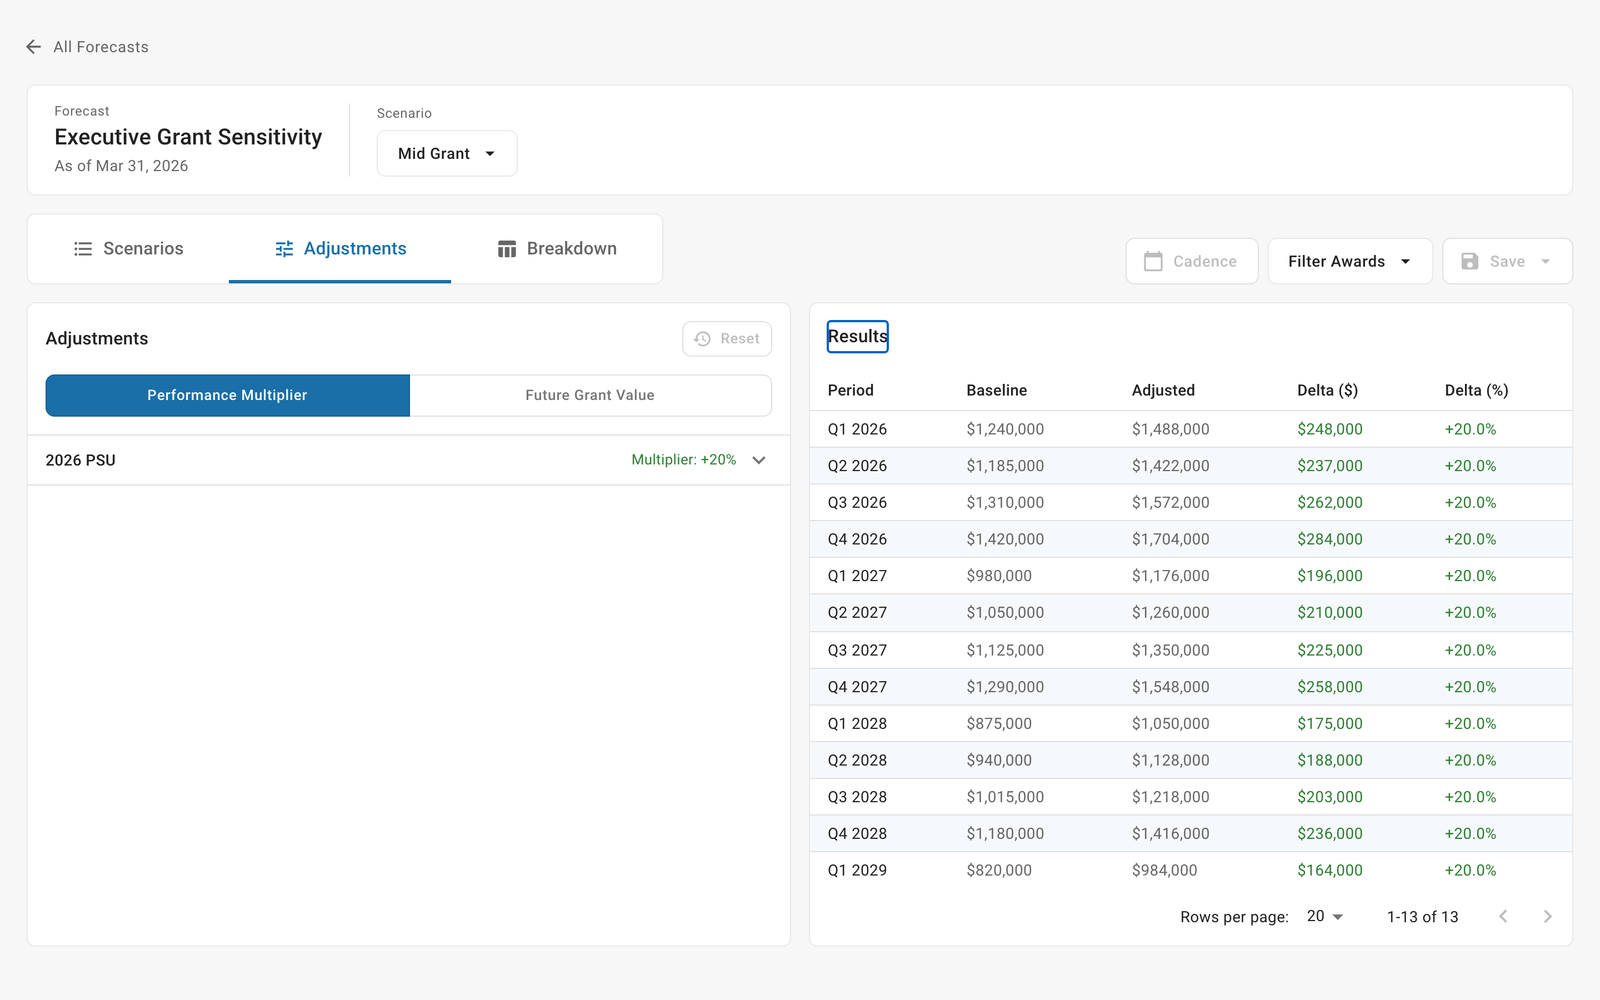
Clients change a small set of assumptions, such as how well performance awards pay out or the value of future grants. Keeping the list short makes it clear what drives the result.
Results
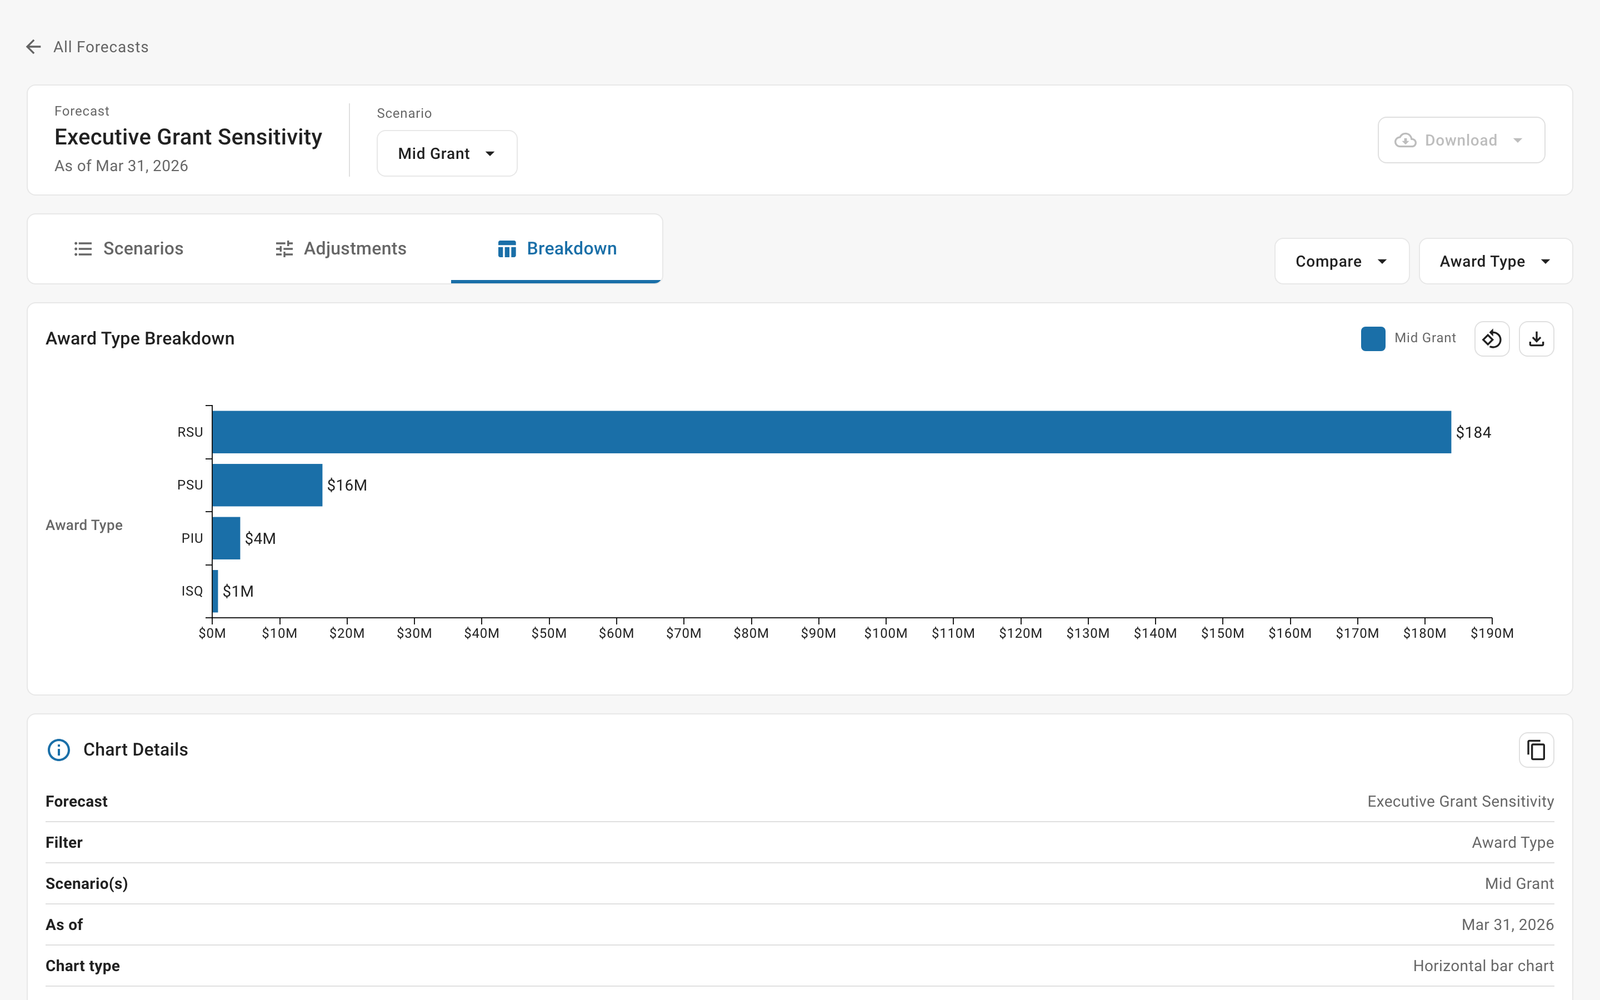
Results are shown against the baseline and can be broken down by customizable categories, such as award type, business unit or cost center, so a team can see where a change comes from and not only the total.
 Outcome
Forecasting gives clients a working tool inside the portal that sits alongside the firm's forecasting services, so clients can explore on their own and still rely on Equity Methods for the baseline.
ReflectionHow much the locked baseline mattered. Clients were far more willing to experiment once they knew they couldn't break the original numbers.
I'd test the results views with finance users sooner. Charts that make sense to the team building them don't always read the same way to the people using them.